Using Grafana
The Grafana dashboards will give you an advanced look into your node, with a dashboard breaking down several key metrics. You can access Grafana Dashboards on all setups:
Setting up Grafana Dashboard
Dappnode
To access your node's Grafana Dashboard, you just need to install the DMS package.
(1) Go to the DAppStore and install the package DMS. It stands for Dappnode Monitoring System and will give you access to your node's dashboards.
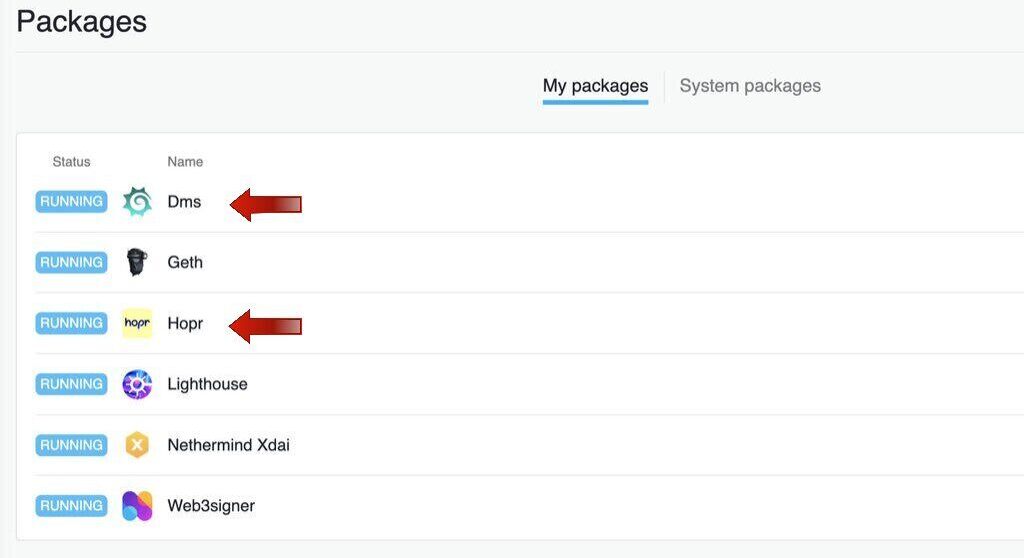
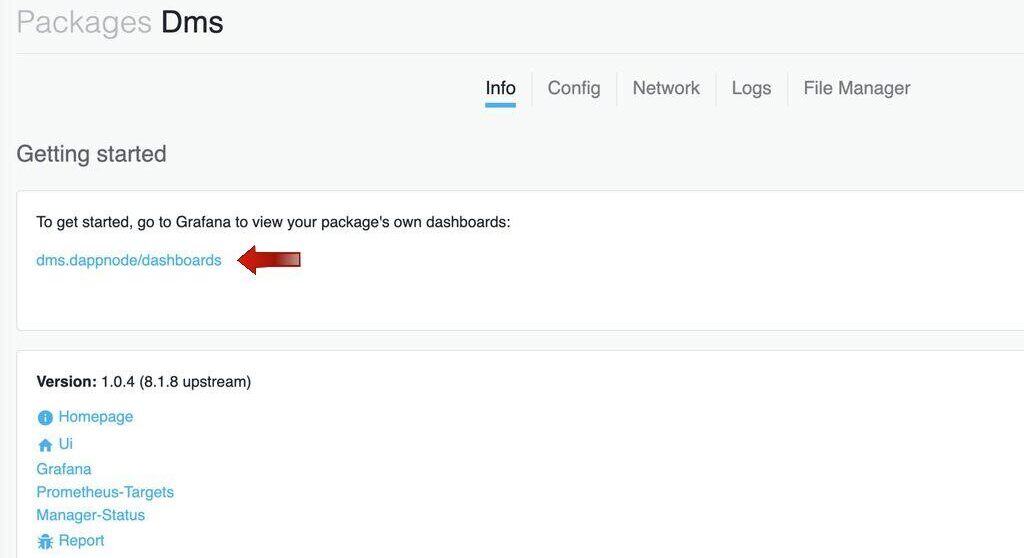
(2) That's all! If your node and DMS package are running fine, you can access your Grafana dashboard by clicking the link on your DMS package.
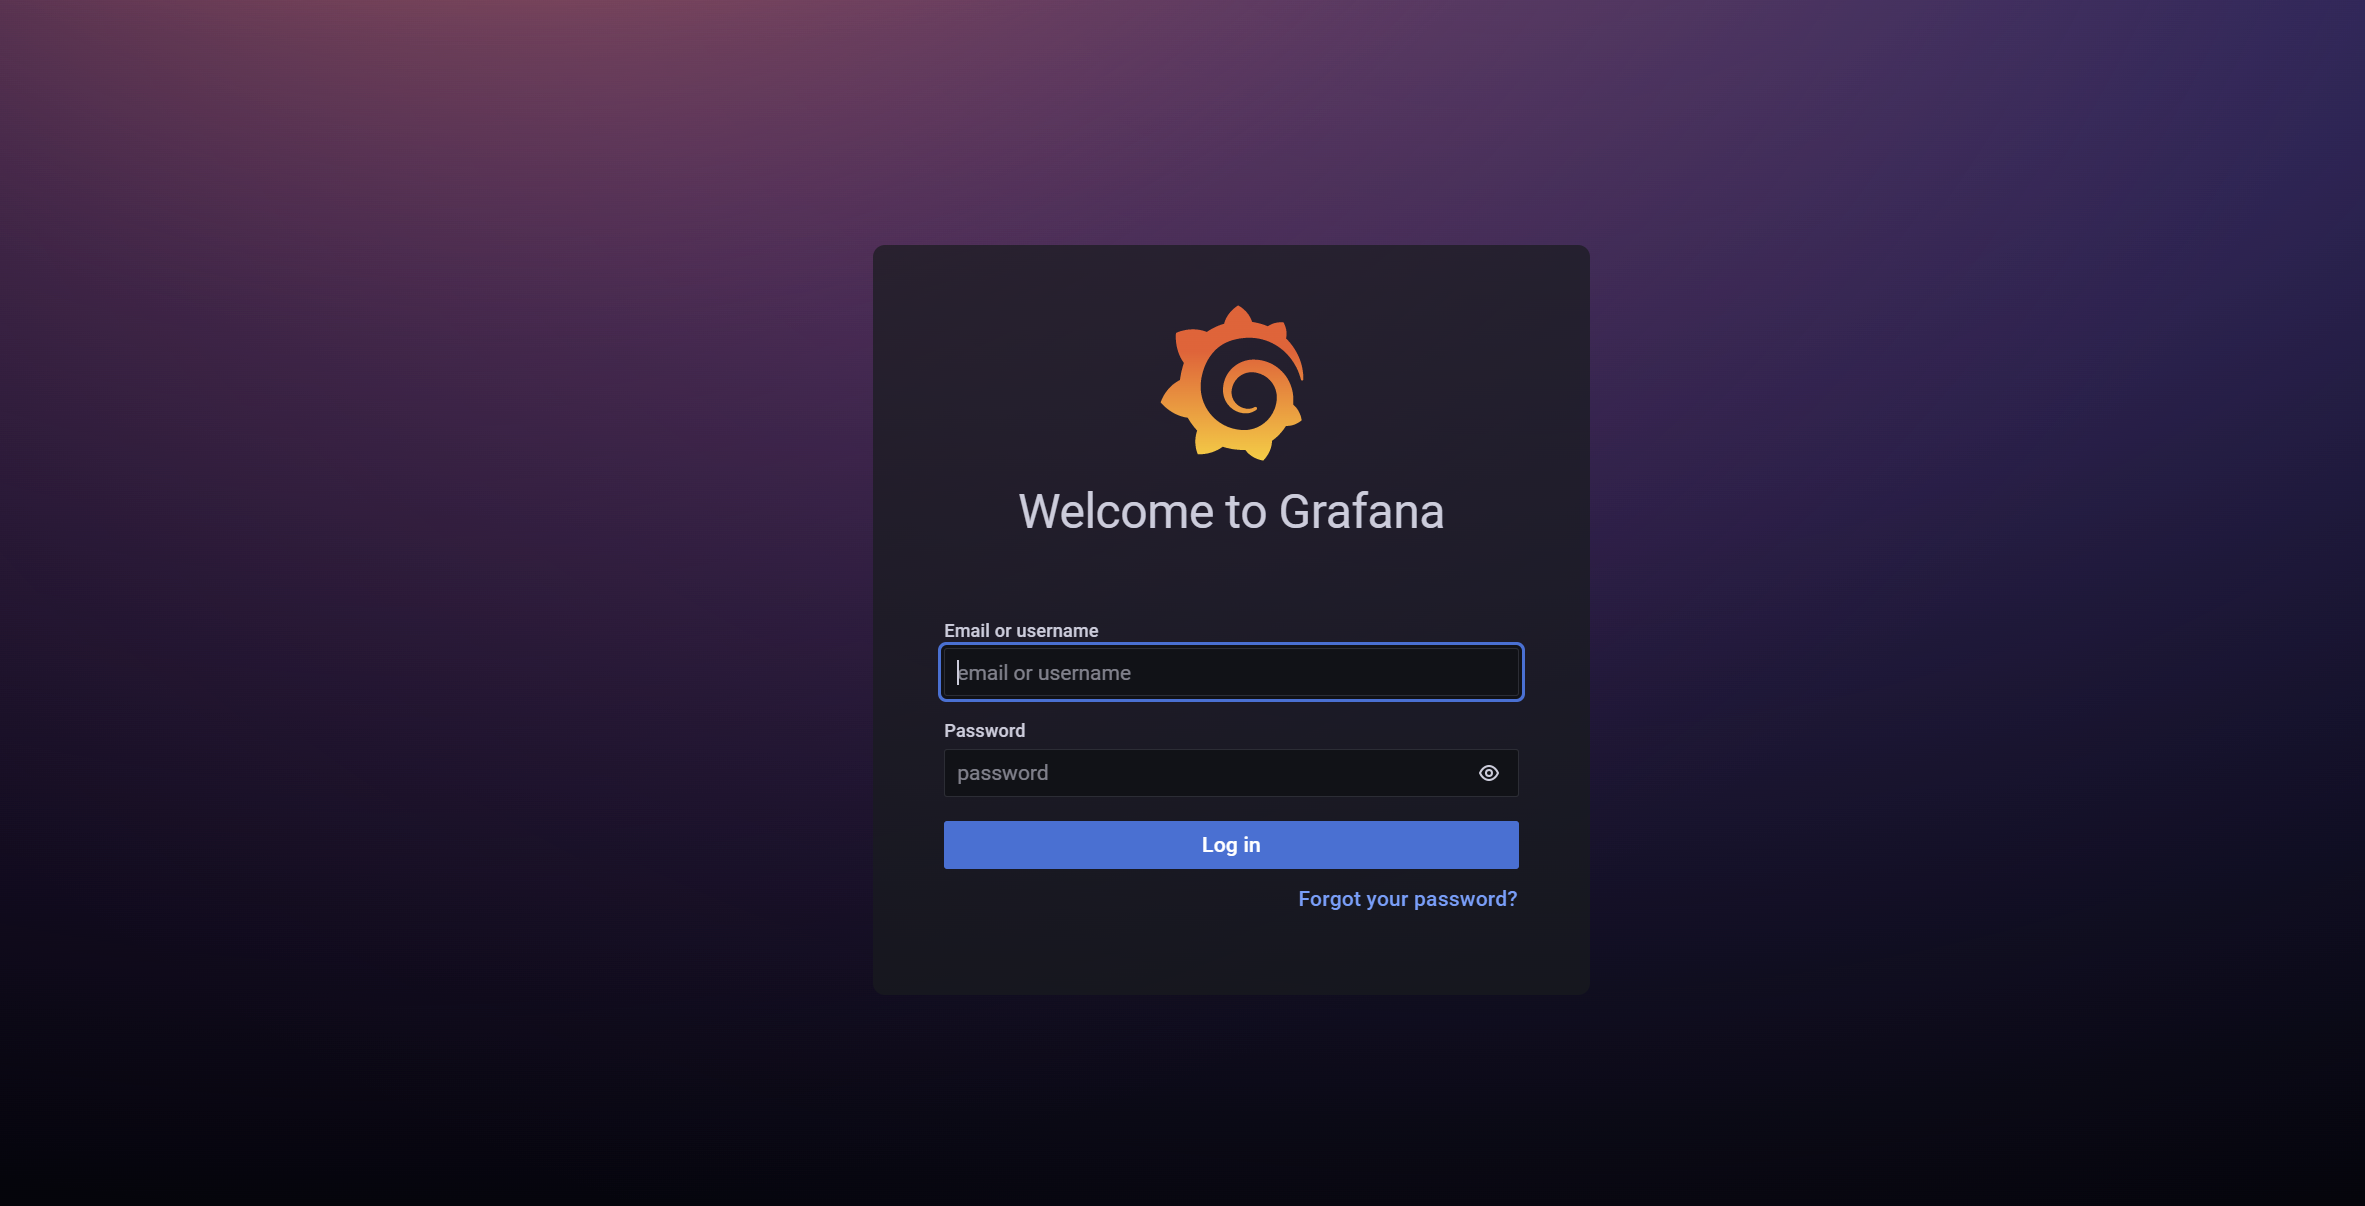
You should get a login screen, where you'll need to use the following credentials:
- Username:
admin - Password:
hopr
Avado
For Avado, you can access the Grafana dashboards by just visiting the URL: http://hopr.my.ava.do:3030/. This is assuming you have HOPR installed on your Avado. You can view instructions on how to do so here.
You should get a login screen, where you'll need to use the following credentials:
- Username:
admin - Password:
hopr
Docker
To set up Grafana with docker you will need to have installed:
- Docker with docker-compose support, you may need to install this seperately. Read here.
- git E.g. through shell with
sudo apt-get install git
The following are command line instructions for Linux:
(1) Clone the hoprnet monorepo using the following command
git clone https://github.com/hoprnet/hoprnet.git
(2) Enter the downloaded file
cd hoprnet
NOTE: It is highly recomended to change the default HOPRD_PASSWORD in the scripts/compose/.env file when running the HOPRd using Docker Compose.
(3) Run the following command to start up a HOPRd node with monitoring capabilities:
docker compose --file scripts/compose/docker-compose.yml up -d
Once your HOPRd node is up and running, you should have Grafana exposed on port 3030, E.g. if you're running this locally and not on a VPS, it would be at the endpoint http://localhost:3030 (replace localhost with your server IP address if you are using a VPS, for example, http://142.93.5.175:3030).
You should get a login screen, where you'll need to use the following credentials:
- Username:
admin - Password:
hopr
Using an Existing Docker Node
It is possible to migrate another node's identity into your new Grafana-enabled docker node by moving your identity file into the running docker container.
For example, you could migrate your identity file suffixed with the release Riga into the new node with commands such as the following:
mv $HOME/.hoprd-db-riga $HOME/.hoprd-db-bratislava
mv $HOME/.hoprd-db-bratislava/.hopr-id-riga $HOME/.hoprd-db-bratislava/.hopr-id-bratislava
Note: This requires the Docker compose file containing the identity file to be mapped to $HOME, which is not the default. Also, the new node still won't have an authentication token, so this is not recommended.
Using Grafana
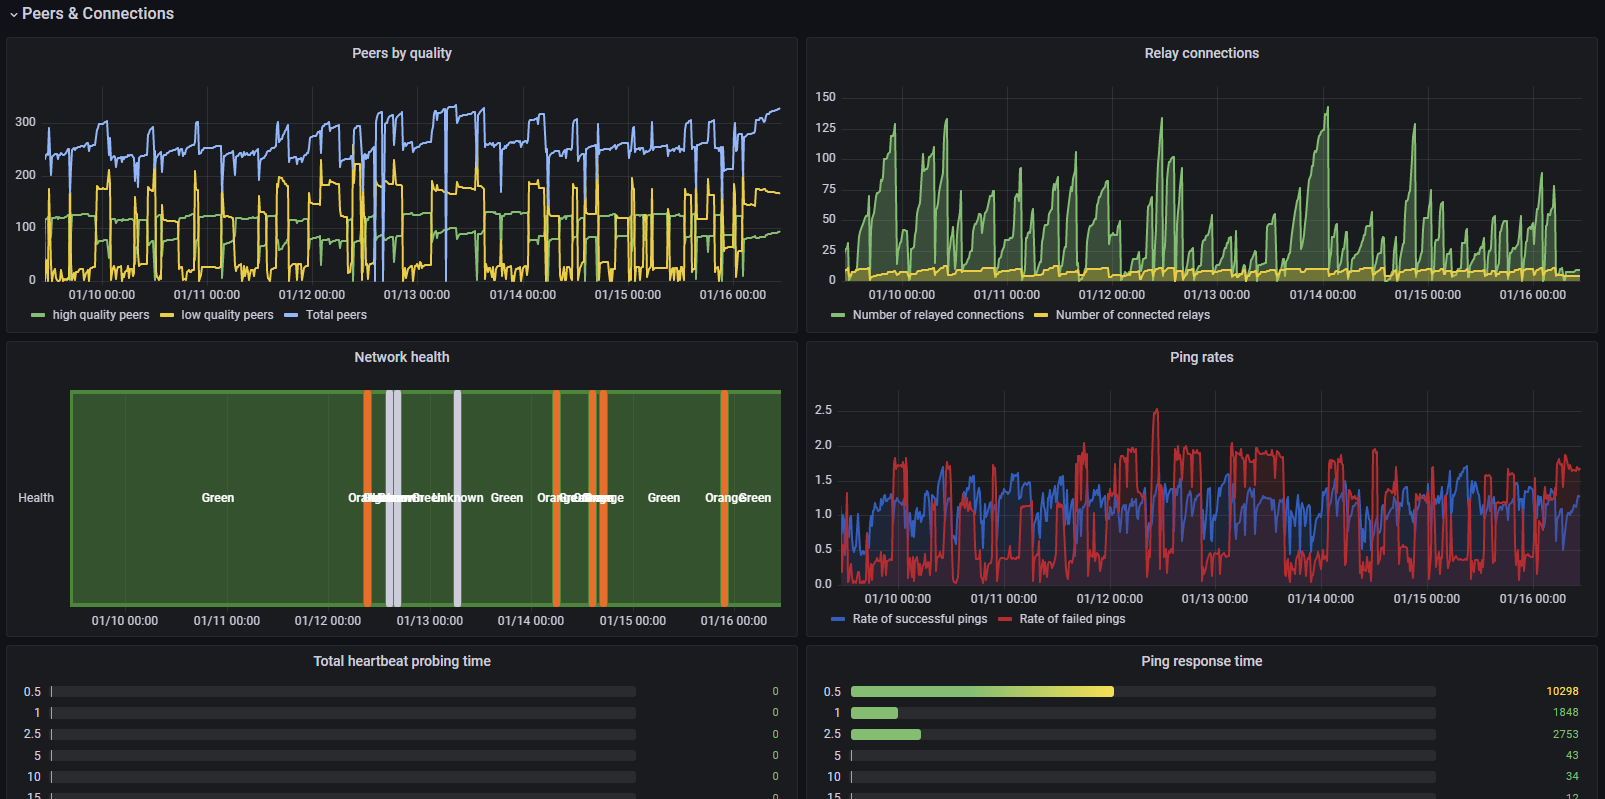
Once you have logged into Grafana, you can access your node's metrics by locating the dashboard: HOPR NODE Overview.
(1) Log into Grafana using the credentials:
- Username:
admin - Password:
hopr
(2) Under Dashboard, look/search for HOPR NODE Overview, under the hopr category.
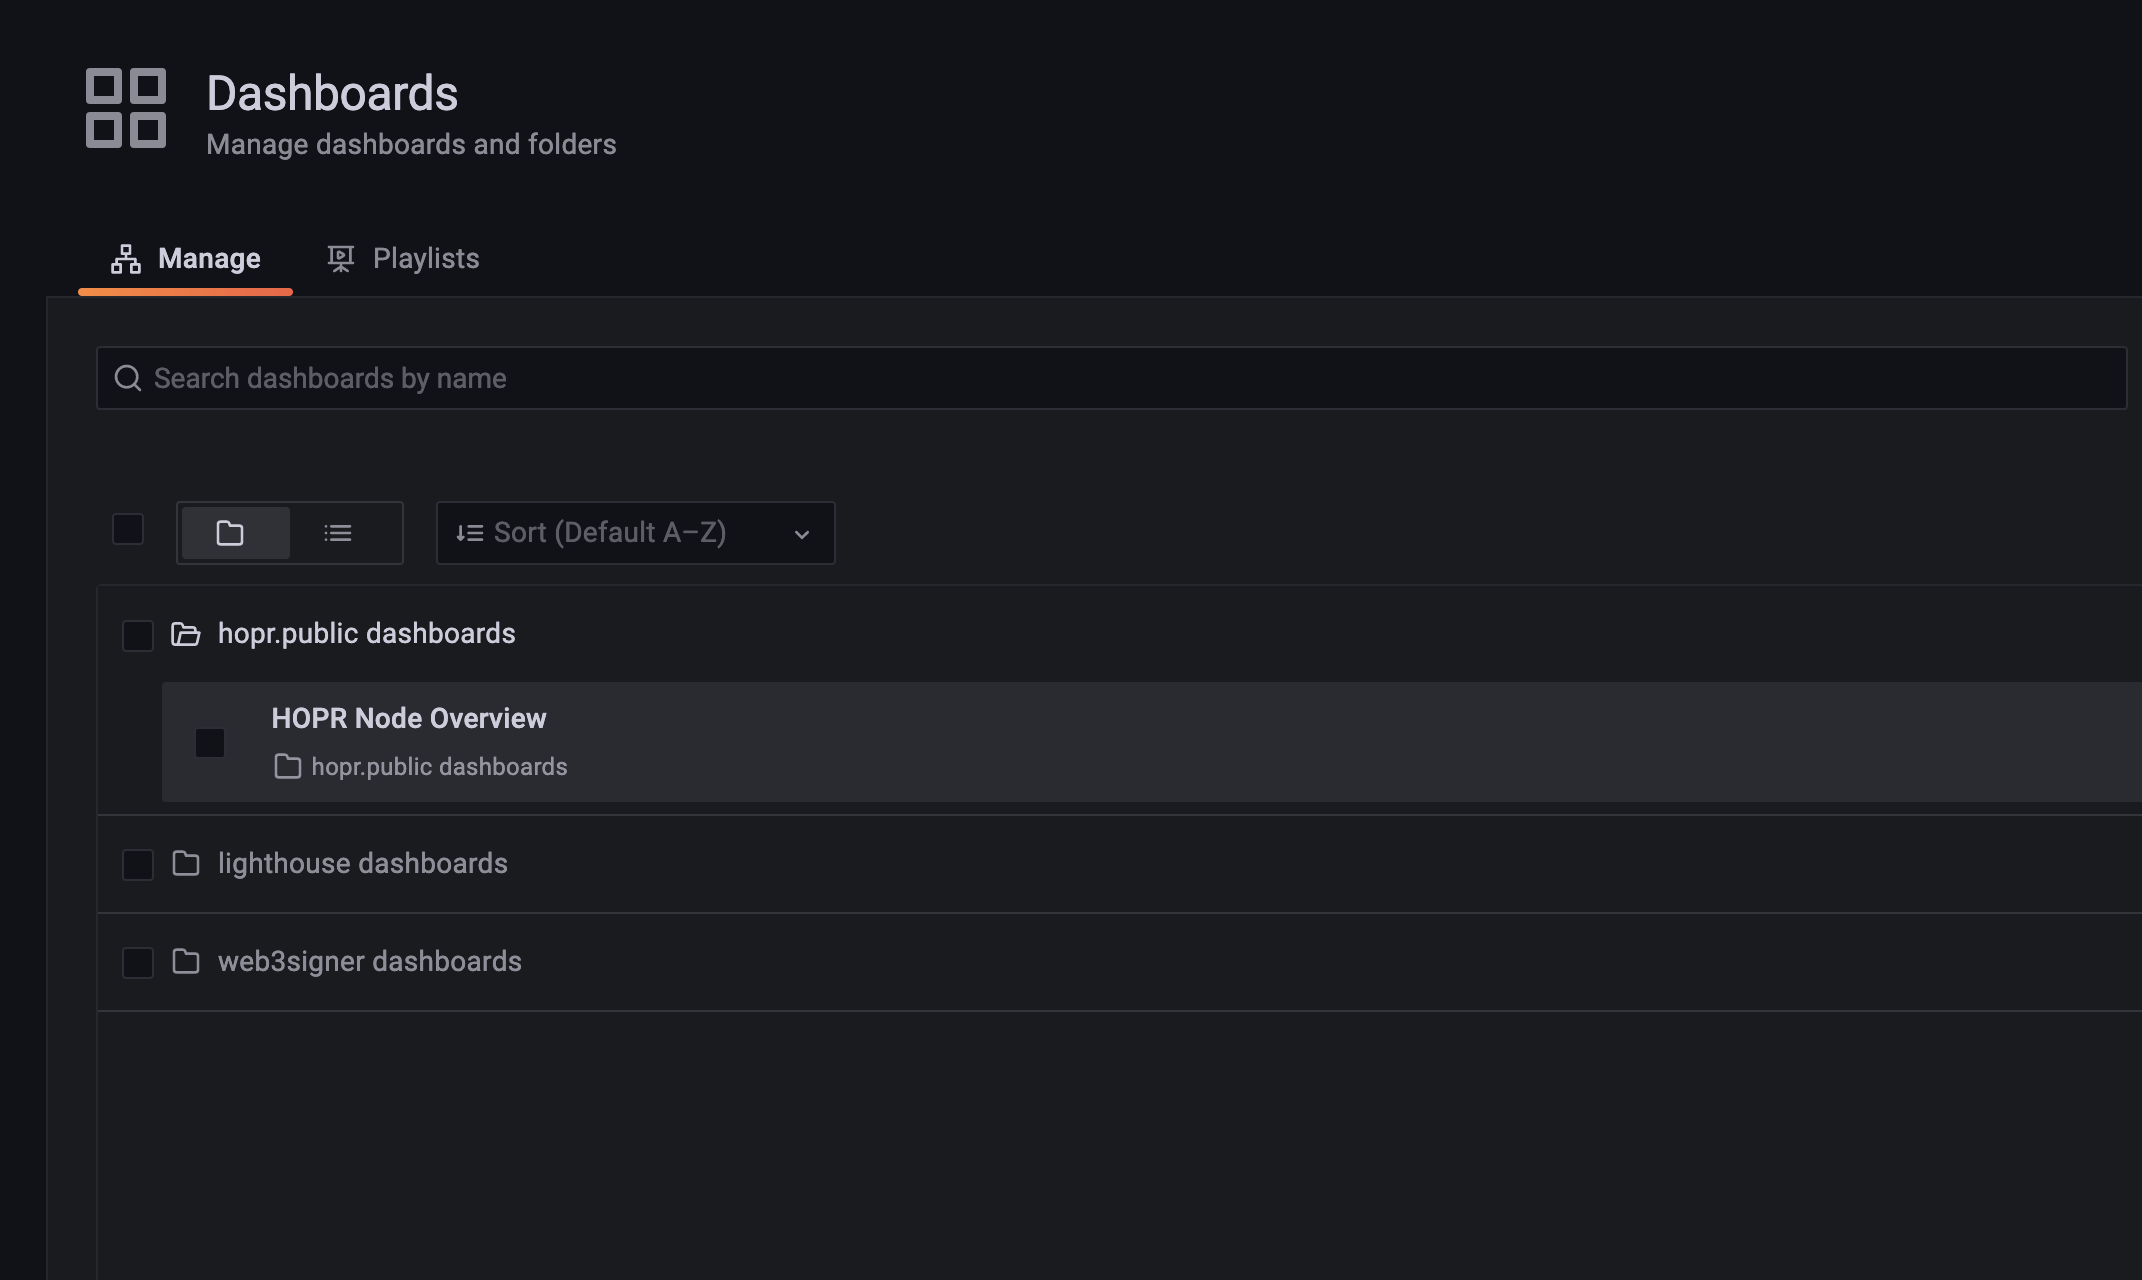
(2) Opening this dashboard will give you access to your node metrics.
Note: The image below is of a node outside the network, hence why all the graphs are flat. Your graphs should not be flat if you have a registered working node within the network.
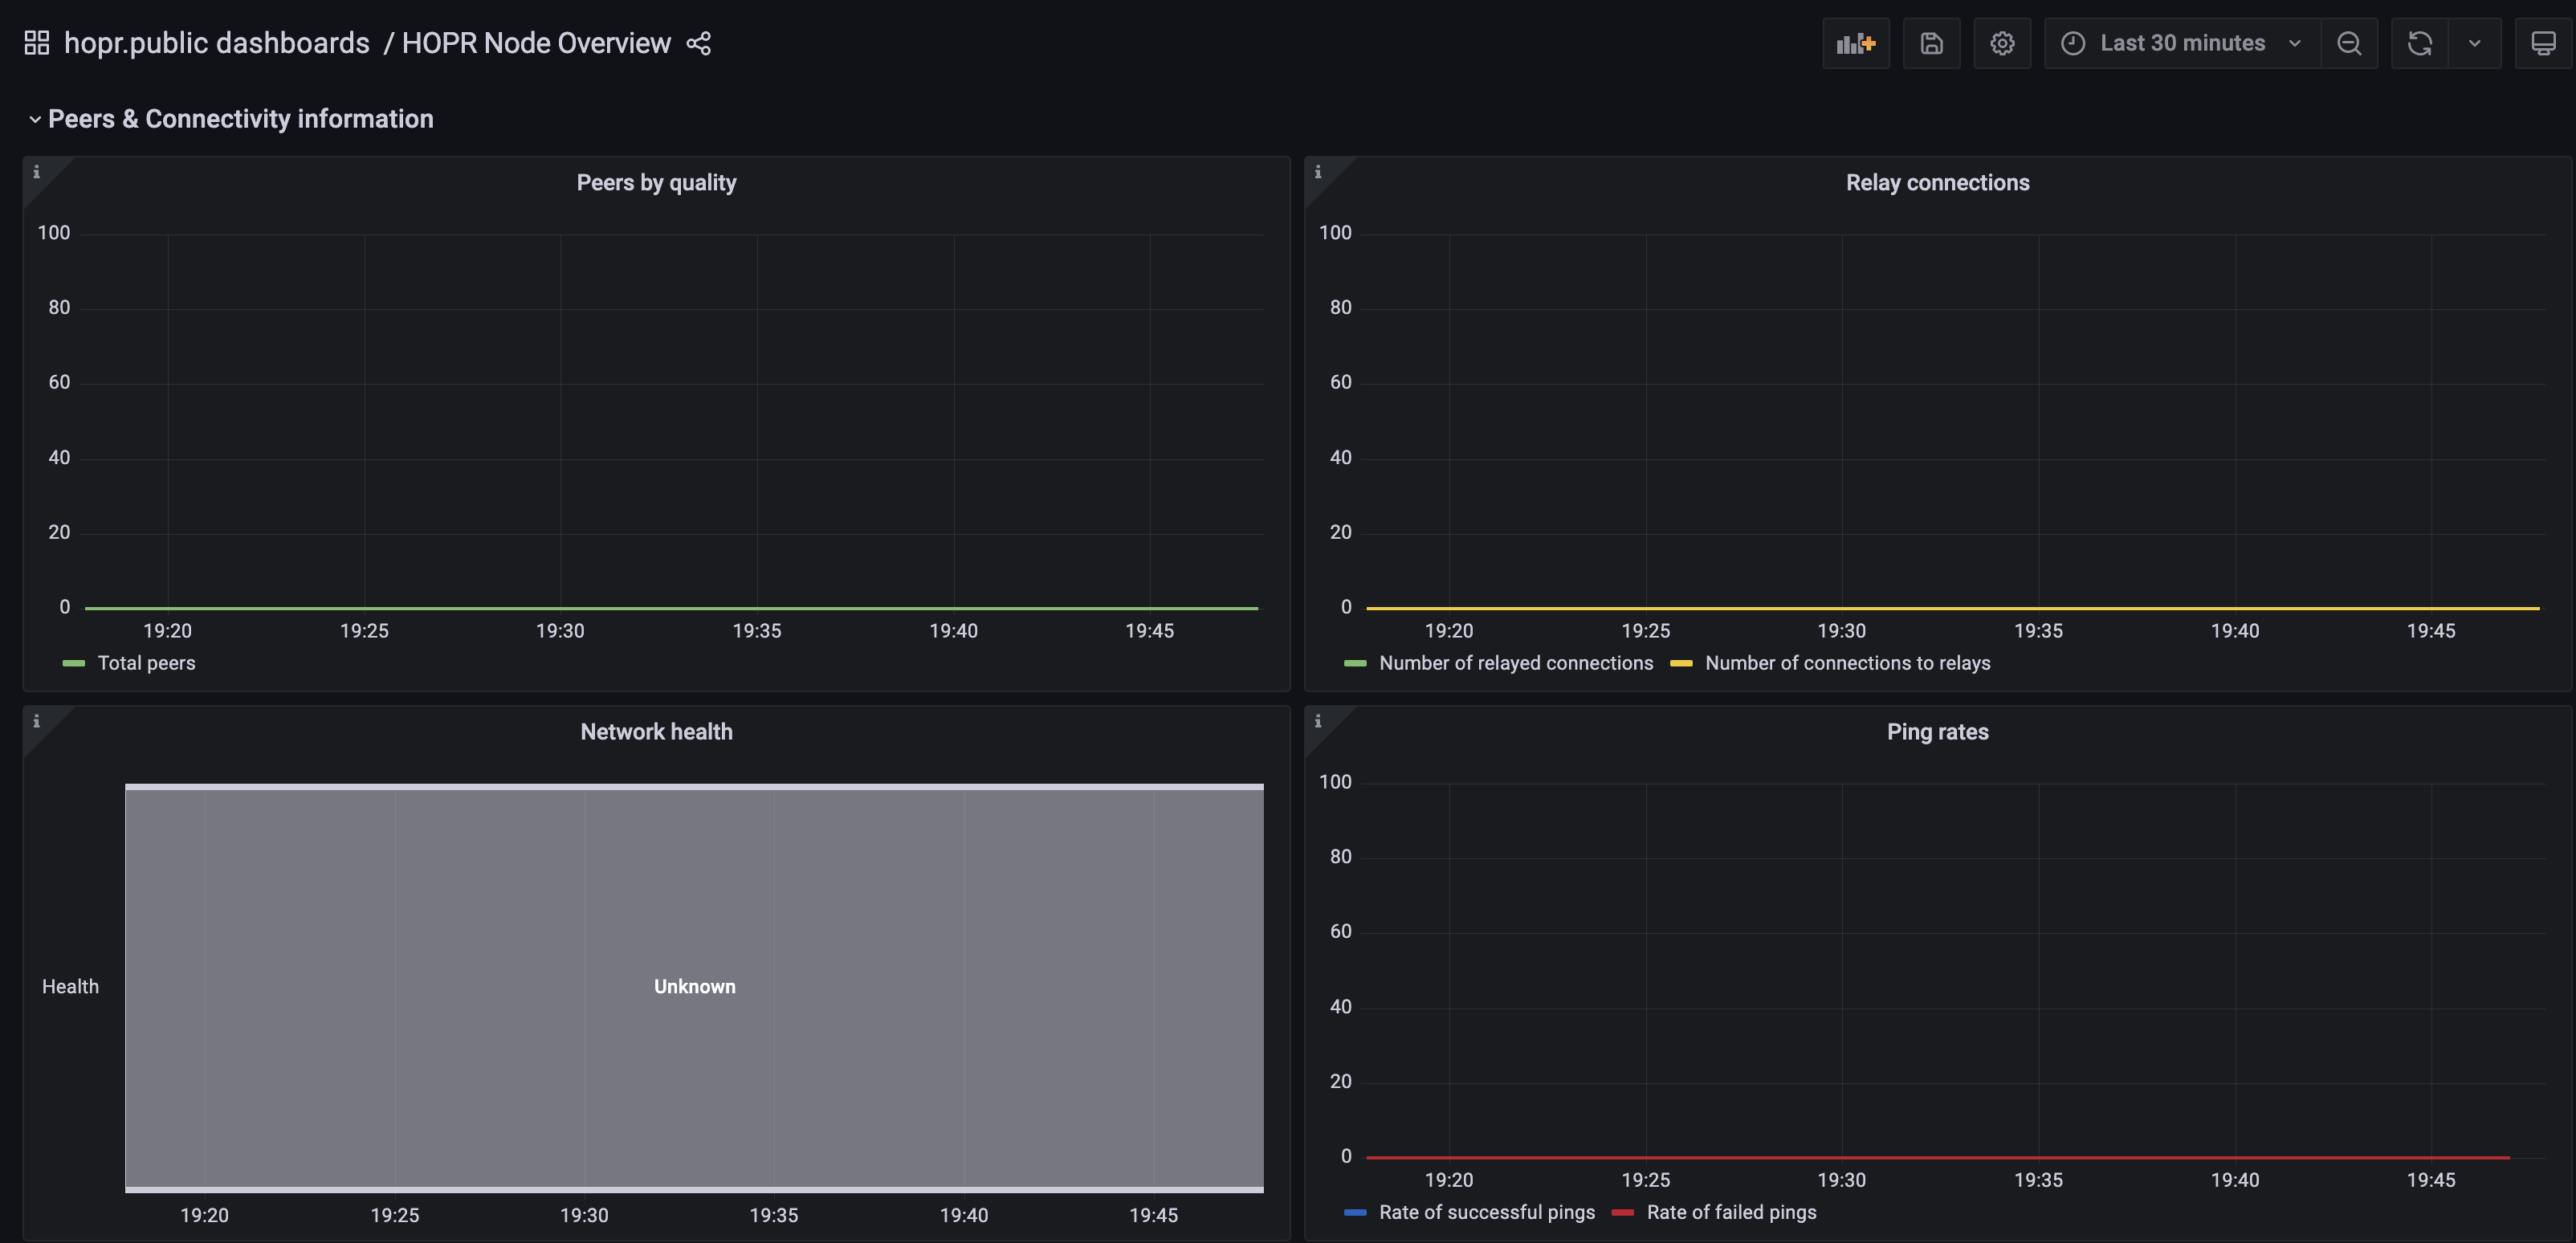
Each dashboard will have a description and tooltip explaining what you are looking at for all the major and important metrics.